A brief about Microservices with Cloud Native environment
“The microservices and cloud-native deployment” – an eye-catching combination that every telco operator wants to see in their applications infrastructure.
Nowadays every telco operator is shifting towards 5G solutions and upgrading their existing application stacks to brand new performance-centric solutions. They want onboarding and activations of customer services within a few seconds. With this in mind, it is very much essential to have high-performance services for business-critical operations and to achieve service level agreements (SLA).

In recent years, enterprises have become more agile and moved towards DevOps and continuous testing approaches. Microservices can help create scalable, testable software that can be delivered rapidly.
Microservices are the core of cloud-native application architecture, and they have become a key tool for companies that are making the move to the cloud. Microservices arrange an application into multiple, independent services, each of which serves a specific function.
Have you ever thought – how can your application perform 10x faster? Or is your application facing a performance issue?
Then, this might be the place you were looking for. There are some areas that we have identified and can be useful for you to find a benchmark for your application. So, fasten your seatbelts and enjoy reading this blog.
- Find the minimal replicas of the application PODs for the defined throughput
The simple rule to start with is – to find the right combination of microservices PODs (Point of Delivery) to serve the defined throughput. It is not advisable to put high traffic on a random number of PODs without knowing the execution behaviour.

The resource allocation & combination of PODs depends on multiple factors like…
- CPU & Memory usage
- The communication protocol between the services
- Cache Size – It directly affects the memory requirement
- Threads configuration in the application server
- JMS Queue consumer configuration and broker policy parameters
- Number of database transactions per single request execution
In digital Service Provisioning, there are different services involved for order processing. We have defined resource allocation and POD combination based on all the defined factors. With a list of performance runs, we found the best combination of PODs to process 100 orders per second using HTTP Rest synchronous execution.
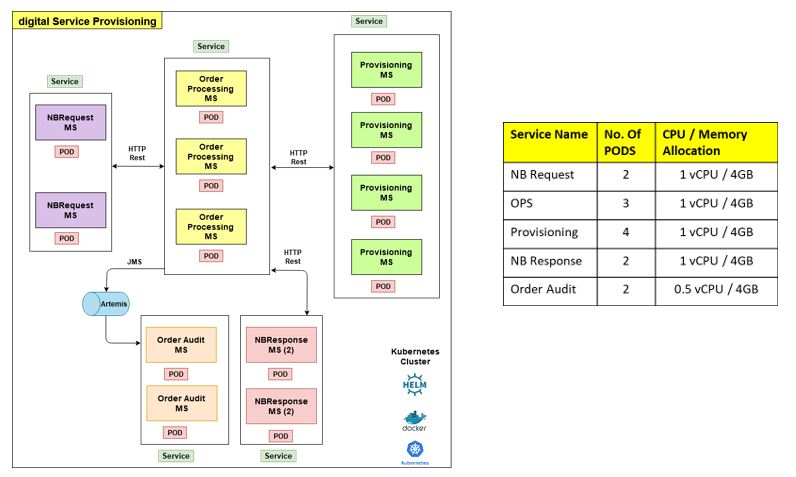
Looks Good!! Now you are ready with the minimal replica set of application PODs.
- Code Improvement – The Ultimate Requirement
The application performance depends on how good we have followed the best practices during the development. Below is a list of code-improvement-areas which we have implemented in our application for better performance,
- Reduce excessive use of String concatenation – Use StringBuilder to concatenate strings
You generally find different articles talking about how good it is to use StringBuilder instead of String. This is critical for application performance. With this change, we were able to reduce (1) heap memory usage, (2) GC execution count and (3) order execution time.
- In-memory execution by reusing the same objects
The number of object creation directly leads to more memory usage and the degradation of application performance. Try to reuse the same object instead of recreating the same object again and again to boost the application performance.
The database round trips lead to performance bottlenecks. Try to avoid database execution as much as possible by doing In-Memory execution. We can complete a data audit asynchronously at the end of request execution using Audit Service.
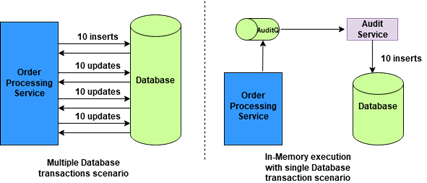
- Don’t use the default configuration of third-party libraries blindly – Use the best effective configuration
While using third party libraries it is very much important to check the behaviour of each API and parameters. Let us see one interesting example. In our application, we are using a hazel cast for the caching solution. For better application performance, we are using NearCacheConfig which stores objects in the application-memory to avoid network calls.
The below diagrams showcase how a change in a single parameter can drastically affect performance.
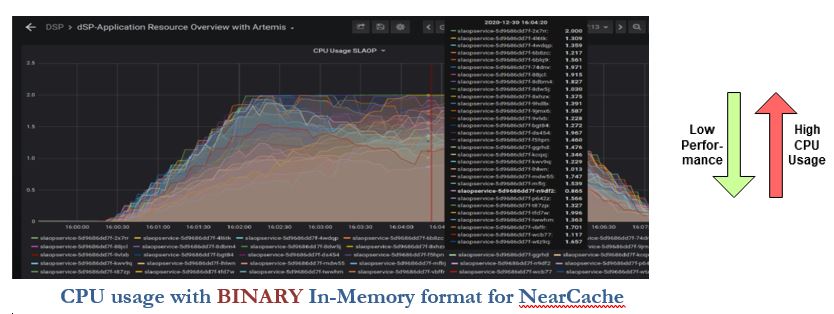
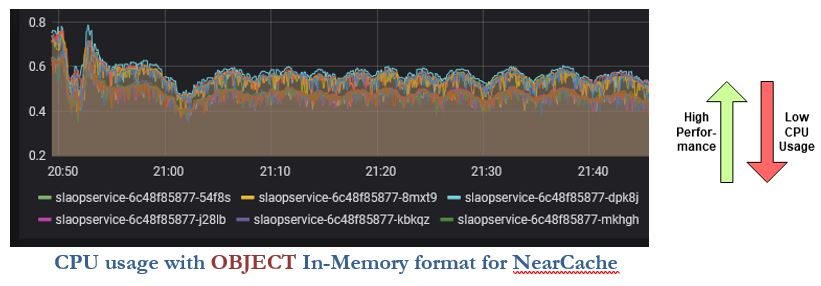
By only changing ‘In-memory’ format from BINARY to OBJECT, the CPU usage was drastically reduced, and application performance improved from 1x to 4x. Yup, this is true.
Thread dump is helpful to find such problematic application execution behaviour.
- Always put check of current log level to avoid creating unnecessary string objects
- Monitor JVM metrics
We can improve application performance by careful monitoring of Thread, Heap usage and G1GC frequency. For better monitoring and visualization, we are using JMX Exporter, Prometheus metrics and Grafana dashboards.
For more details, please refer to our blog on ‘Monitor JVM metrics’
- Don’t optimize the code before you know it’s necessary. First find the time-consuming part.
It is required to find the specific section of code which seems to be problematic for the performance. There are different ways to find the time-consuming code areas.
- Use libraries like micrometre to export performance metrics to Prometheus
We can export different metrics of the application like ‘total request count’, ‘execution time’, ’time consuming requests’ using the micrometre. We can use all these metrics to prepare Grafana dashboards for proper visuals and monitoring.

For more details, please refer to our blog on ‘Microservices and exposure of Custom KPIs in Cloud Native environment’
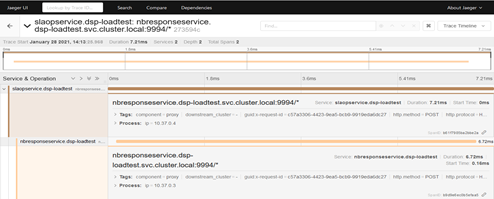
- Use tools like Jaeger for distributed tracing
Jaeger provides distributed request tracing. In case, there is network latency between two services, and it is increasing end to end request time then we can easily find such behaviour using Jaeger.
- Understand, monitor, and fine tune database queries
The number of database queries during the request execution directly affects application performance. It is very much required to find the total number of queries and cost of each query execution.
We can avoid…
- Unnecessary query execution by using the cache
- Too many joins and subqueries in Select queries
- Too many indexes in the table
We should…
- Use batch mode for data insertion
- Use ANSI SQL queries
- Do a smaller number of database transactions
There are different tools available to find cost and effectiveness of database queries. Postgres provides tools like ‘pgBadger’ to generate html reports for database query monitoring. It provides details like ‘Slowest individual queries’, ‘Most frequent queries’, ‘Time consuming queries’, ‘Vacuuming detail’, etc.
- Linear scaling – The End Goal
Linear scaling is the ultimate requirement for any enterprise application. The customer always looks for how well the application supports linear scaling.
We can prepare different graphs based on the allocated CPU, actual CPU usage, scale-ratio and throughput to check linear scaling behaviour. The sample graphs are given below.

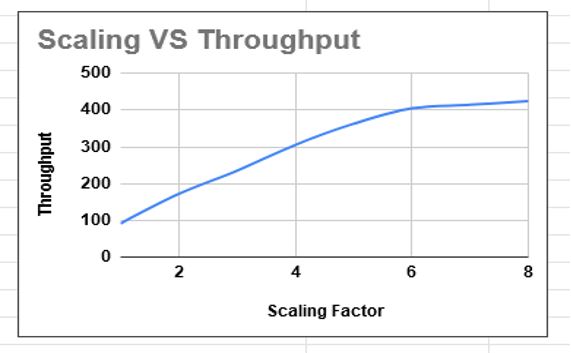
As such you find linear scaling then it can be considered as the scalable application.
- Conclusion
The performance benchmarking process requires much time and patience during the entire activity. All you need is – 1) the right direction to trace the issue & 2) the right actions to solve the issue.
Happy Load Testing!


